Planning is the process of identifying needs, establishing goals to meet those needs, and then developing and implementing a set of strategies to achieve the goals. Of course, implementation requires funding, and this section of Whatcom Mobility 2040 identifies the funding sources reasonably expected to be available to implement the strategies and projects in this plan along with recommendations for additional financing strategies. In accordance with federal regulations, Whatcom Mobility 2040 is fiscally constrained, i.e., its projections of future funding are conservative to ensure that the cost of planned projects will not exceed available financial resources. WCOG’s financial analysis of regional transportation costs and revenues is based on historical trends of revenues and expenditures along with a review of previous regional long-range transportation plans. This analysis takes into account the unique circumstances of each program area, such as local roads, state highways, bicycle and pedestrian facilities, and transit.
Obviously, shorter-range forecasting tends to yield more accurate results than that performed for time periods farther in the future, and this is especially true today given the rapid advancements in transportation technology (such as automated vehicles), private-sector engagement in transportation (Google, Lyft, Uber, etc.) and evolving generational preferences such as the trend among younger adults to live in urbanized areas without owning a car. For these reasons, Whatcom Mobility 2040’s financial forecast is broken into two time periods:
- 2017-2027: This forecast period is based on a list of programmed and planned projects that will or are highly likely to be advanced by the region’s jurisdictions.
- 2028-2040: Outer-year revenues and planned expenditures are aggregated to account for the uncertainty posed by the likelihood of changes in project costs, economic conditions, new regulations and local priorities.
Financial assumptions
Federal, state and local revenue estimates change over time and are revised regularly due to a variety of factors including adjustments for actual uses, changes in funding estimates, and other economic conditions. Despite fluctuations, the estimates in this plan depend on some reasonable assumptions to set a baseline and estimate future trends in transportation funding for the region. Assumptions include the following:
- Federal funding will continue to be available in similar amounts for regional roadway and transit infrastructure. U.S. transportation acts will continue through the planning horizon period, currently the FAST Act authorizes federal funding.
- Because the Whatcom region’s economic vitality and quality of life depend on a functioning transportation network, state agencies and local municipalities will continue to invest to maintain and preserve the transportation network. Therefore, it is assumed that state and local resources will support the transportation system of this region through 2040 with levels comparable to recent years.
- Funding will continue to be available for transit. Transit funds in the region are administered through the WTA in the form of federal grants, revenue bonds, pay-as-you-go funding, and interest earnings. WTA has been able to refinance bonds, cut expenses and improve fare box revenue through increased ridership and will continue to work at innovative financing to maintain its level of service. It is therefore assumed that WTA will maintain similar levels of funding as in recent years.
- Bond proceeds and debt payments have a minimal influence on transportation investments in the region and will continue to. However these are difficult to forecast and are not reasonably expected to be available. Therefore have been excluded from long-range plan consideration.
- The Port of Bellingham manages the BIA and maritime freight activities in the region. Federal and state resources used to support these activities reside outside the requirements of the FHWA, Federal Transit Administration and WSDOT for inclusion in metropolitan and regional transportation plans, and therefore they are not included inWhatcom Mobility 2040. Planning documents for the Port of Bellingham can be found through this link.
Historical and current funding
As mentioned previously, the Whatcom region utilizes several funding sources from all levels of government to finance regional transportation projects. Historical revenues and expenditures inform the 2040 financial forecast.
Federal funding
The Whatcom region receives federal support through two primary sources:
- FHWA provides funding for a number of regional projects through several programs, such as the National Highway System, Interstate Maintenance, the STBG program, and the Coordinated Border Infrastructure program.
- Federal Transit Administration (FTA) administers programs to fund transit operators and other regional transportation agencies, such as its Rural Transit Assistance Program, the Metropolitan and Statewide Planning program, and the Transit Cooperative Research program.
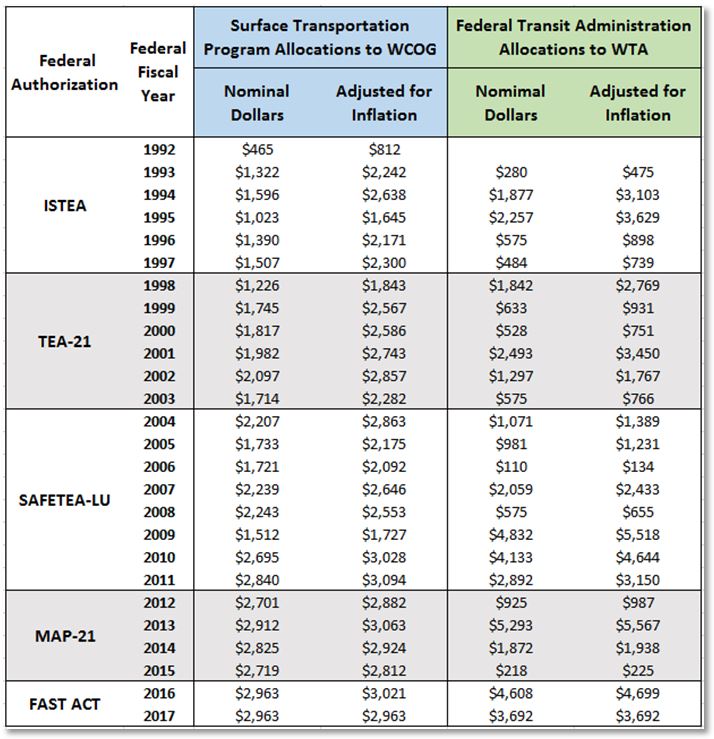
FHWA’s STBG program funds are allocated to WCOG, allocations of FTA 5307 grant funds are managed by WTA. Both federally managed programs receive apportionments based on the federal authorization at the time. The following table illustrates the federal transportation funding in the region since 1992.
Table 14: FHWA and FTA Allocations to the Whatcom Region (in $000s)
State highway funding
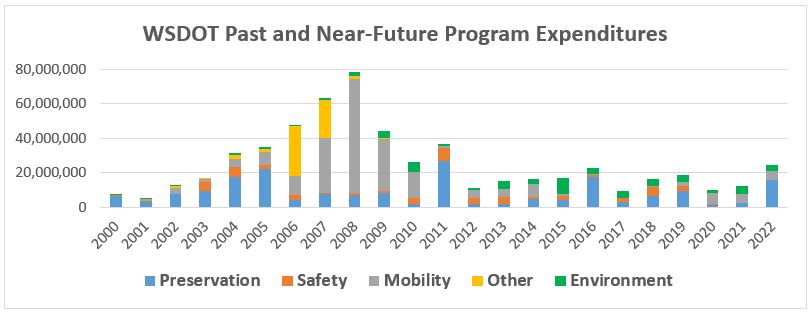
WSDOT manages state facilities and operations. State highways make up 11 percent of all roadway miles in the Whatcom region and 45 percent of regionally significant roadway miles. State highways also support the highest vehicular activity in the region. WSDOT funds state highways with both federal and state revenues primarily generated from fuel tax revenue. Figure 11 illustrates the trend line of WSDOT expenditures in that agency’s funding categories: preservation, safety, mobility improvements, environmental, and other projects.
Figure 11: WSDOT Past and Near-Future Program Expenditures

Note that WSDOT currently has investments identified in the regional and state capital improvement program for years 2017-2022. A recent peak in state program funding occurred from 2006 to 2009 during the federal transportation authorization act known as SAFETEA-LU, when there were also annual legislative appropriations that benefited the region. Since that time, program funds making their way to the region have hovered in the $10-20 million range annually with the continuance of funding through 2020 from the current federal transportation authorization (the FAST Act).
Local funding
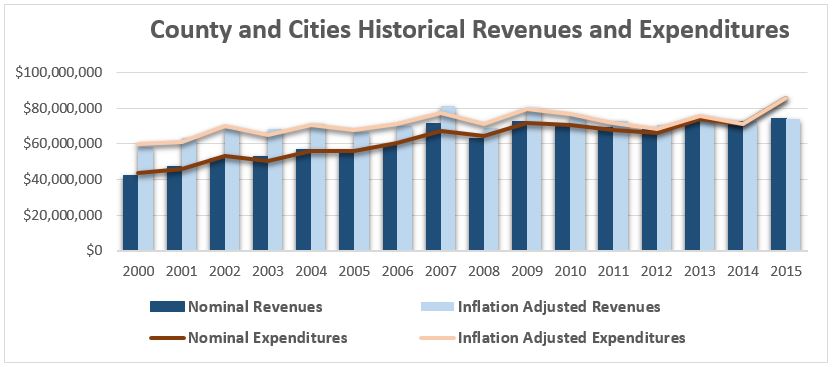
Whatcom County’s seven cities maintain local roads within their jurisdictions, while the county does so for roads in the unincorporated areas. As indicated in below, the region’s local governments have seen their expenditures increasing at a faster rate than revenue (local tax collection and state and federal grant funds), making it more difficult for them to make the necessary improvements to locally-owned roads on the regional transportation network.
Figure 12: County and Cities Historical Revenues and Expenditures

The following charts depict the recent five-year averages of transportation funding and expenditures for the region’s cities and county. The majority of funding is generated locally and the bulk of transportation investments is expended on maintenance and operations.
Figure 13: Local Jurisdiction Funding and Expenditures

Revenue and expenditure forecast
In general, transportation funding sources are in decline. It is therefore important to consider how funding is designated for specified project categories. For the purposes of this plan, four project types are identified: operations, maintenance, preservation, and improvements.
Operations: Operations refers to the personnel, facilities, and capital required to administer, plan, engineer, and police the transportation system.
Maintenance: Jurisdictions in the region continuously monitor conditions of the transportation system to maintain a functional state of operation. Maintenance work responds to specific events or seasonal impacts that deteriorate assets. Continuous scheduled maintenance avoids more significant future costs.
Preservation: Preservation encompasses those activities that sustain or improve transportation facilities without adding capacity. Preservation activities such as repaving roads, protecting against rock falls, and rehabilitating bridges are identified through a local needs analysis as well as WSDOT’s pavement and bridge management systems. These projects are typically more expensive than maintenance projects, but when executed well they can reduce future reconstruction costs.
Improvements: In addition to maintaining and preserving existing system components, this plan includes a recommended set of projects to improve safety, access, connectivity, mobility, transportation demand management and transportation alternatives. Improvement projects that add vehicle capacity are typically very expensive and thus, completing even a small number of them reduces a region’s ability to pay for basic preservation and maintenance on originally anticipated schedules. Conversely, improvement projects that expand mode sharing, such as adding bicycle lanes, tend to be less expensive.
WCOG Transportation Improvement Program
Anticipated resources for transportation projects listed in the regional TIP have been considered in the financial forecast. The TIP provides a six-year comprehensive list of transportation projects that utilize federal funds or are considered a regional project. The total cost of projects programmed, funded and schedule to spend in the first four years of the WCOG 2017-2022 TIP do not exceed anticipated resources and are thus deemed to be fiscally constrained.
Balance sheet
The assumptions applied to the Whatcom region’s long-term financial forecast include growth estimates based on local, state and federal sources. There are a host of known and unknown variables that will affect both the revenues acquired and expenditures necessary to sustain the regional transportation system. WCOG, with the assistance of local and state partners, developed a financial forecast to conservatively estimate future outcomes.
The listed regional transportation projects programmed through 2040 are fiscally constrained.
Table 15: Estimated Revenues and Expenditures (In $000s)
| Years | Program | Revenues | Expenditures | Difference |
|---|---|---|---|---|
| 2017 – 2027 | Cities and County | 950,513 | 986,525 | -36,012 |
| WSDOT | 173,480 | 179,254 | -5,774 | |
| Transit | 50,053 | 42,177 | 7,876 | |
| Totals | 1,174,046 | 1,207,956 | -33,910 | |
| 2028 – 2040 | Cities and County | 1,195,778 | 1,332,668 | -136,890 |
| WSDOT | 220,408 | 276,037 | -55,629 | |
| Transit | 88,830 | 94,132 | -5,303 | |
| Totals | 1,505,015 | 1,702,838 | -197,822 | |
| 2017 – 2040 | Cities and County | 2,146,291 | 2,319,193 | -172,902 |
| WSDOT | 393,888 | 455,291 | -61,404 | |
| Transit | 138,883 | 136,309 | 2,574 | |
| Totals | 2,679,061 | 2,910,794 | -231,733 |
The balance sheet indicates that future revenues will be insufficient to accommodate the rising costs of maintenance, operations, preservation and improvements for the local and state systems.
Fiscal constraint
For a fiscally-constrained plan, the cost of planned investments in the regional transportation system are compared with the forecast of available revenue needed to complete those projects. Projects are individually prioritized within the first 10-year period (2017-2027) and batched as an aggregate estimated cost for Whatcom Mobility 2040’s outer years (2028–2040). Projects fall into three funding-status categories in the regional plan:
- Currently funded projects are those programmed in the TIP and for which construction will commence during the period 2017-2022. These projects are fiscally constrained.
- Planned projects are expected to secure funding and start construction during Whatcom Mobility 2040’s These projects are also fiscally constrained.
- Illustrative projects support regional goals, but funding for them has not yet been identified and therefore they cannot be classified as fiscally constrained. However, their inclusion in this plan acknowledges their potential value to the region and constitutes a commitment to seek funding for them.
The financial gap
With the exception of transit, available revenues through 2040 are not expected to cover forecast expenditures. Over the same planning period, vehicle miles of travel are forecast to continue rising as the population in the region continues to grow. Improved vehicle fuel efficiencies are also reducing fuel tax revenues over time, which increases the importance of prioritizing transportation investments in order to best maintain a functional regional transportation system. There is no single funding source that will make-up the anticipated revenue shortfall. Rather, employing a combination of transportation strategies and program adjustments will serve to alleviate the gap.
Local jurisdictions
Looking ahead to the 2040 planning horizon, Whatcom County and its incorporated cities have a current estimated shortfall of approximately $173-million. The primary revenue sources for the locally-managed transportation system in the Whatcom region include:
- Property taxes collected by Whatcom County provide nearly 50 percent of revenues generated for transportation spending in unincorporated areas. To a lesser extent, cities also use property taxes to fund transportation.
- City sales taxes and other local receipts contribute more than 50 percent of funding used for transportation spending in incorporated areas.
- Federal funds provide about 16 percent of annual regional revenues.
- State funds through the general fund appropriations, state fuel tax distribution, and other state-generated funds e.g. County Road Administrative Board (CRAB) and Transportation Improvement Board (TIB) contribute nearly 25 percent of revenues.
State highway system
The state highway system managed by WSDOT will have an estimated shortfall of approximately $61-million through the year 2040. Funding for agency operations and programs is primarily generated through the motor vehicle fuel tax. WSDOT also employs other revenue tools and sources such as bond sales, federal funds, tolls and ferry fares.
Strategies to close the gap
Options to more fully implement all regionally identified system improvements, or to bring the costs of planned investments within the bounds of fiscal constraint, include generating more revenue, changing how systems operate (e.g., mode shift, technology, etc.), and prioritizing proposed transportation investments. Prioritization of investments to maximize achievement of regional goals may include emphasis on maintenance and preservation over projects to increase roadway capacity. Other local investments to reduce future system costs include continued support for multi-modal transportation options such as bicycling, pedestrian and transit facilities.
Long-term financial strategies
State and local entities function under their respective policies and decision-making structures that largely determine the funding options available to them. These entities may have to assess their revenue sources over time and will likely make adjustments (requiring policy changes or voter approval) in order to realign planned transportation system investments with available funding.
The City of Bellingham focuses on the continued development of a complete transportation network and operational strategies. Their goal is to reduce single-occupant vehicle use from the current 68 percent down to 50 percent by 2036. By acknowledging peak-hour congestion as an urban reality, Bellingham emphasizes the promotion of pedestrian, bicycle, and transit activities that result in less need for costly improvements.
WSDOT’s Practical Solutions initiative places a premium on low-cost investments, collaboration with regional and local jurisdictions, performance-based management and planning also supports a long-term strategy to sustain the state system. These initiatives and continuous assessments of revenue sources are needed to help close the gap, especially in the outer years 2028-2040.
Revenue tools
Current funding tools
Transportation benefit districts (TBD) can be important revenue options used by county and city jurisdictions in the region. Bellingham’s TBD, Street Fund and the transportation impact fees it assesses together will provide an estimated $250-million through 2040. The state also allows cities within 10 miles of the Canadian border to assess a one percent per gallon “border area fuel tax” to fund local street maintenance and construction. Blaine, Nooksack, Point Roberts (administered by Whatcom County) and Sumas currently collect this tax. Largely paid by Canadians crossing into Whatcom County, this tax generates more $300,000 annually countywide. With cross-border travel generally increasing over time – 18 percent for cars and 11 percent for trucks since 2010 – the border area fuel tax has the potential to generate even more revenue for transportation over the long term.
Future funding tools
For large capital projects in the region that meet specific criteria, the most likely funding strategy will be to compete for federal grants such as Transportation Investment Generating Economic Recovery , Fostering Advancements in Shipping and Transportation for the Long-Term Achievement of National Efficiencies or other programs included in the FAST Act, which will remain in effect until at least 2020.
The State of Washington is studying the feasibility of replacing fuel taxes with “road user charges” (RUC) as a potential alternative to the state fuel tax, which is declining and is expected to decline even further as vehicle fuel efficiency continues to improve. A road user charge would be assessed on vehicles based on the number of miles they are driven in Washington (but not outside the state). An analysis performed by the Washington State Transportation Commission – which in 2018 will conduct a statewide RUC pilot program – indicates that in the early years, a statewide RUC program would net less revenue than the fuel tax, but as its start-up costs are amortized, it would generate a larger and more reliable revenue stream.
Washington State Freight Mobility Strategic Investment Board
The Washington State Freight Mobility Investment Board (FMSIB) was established in 1998 to identify and prioritize freight-related projects to alleviate congestion and freight-related choke-points. Funds are requested from the state legislature to complete these projects and are often combined with local or other sources of funding. Since its establishment, FMSIB has leveraged $177-million toward 53 freight projects statewide totaling $917-million, including a project in Sumas.

